AMZN · Amazon
Amazon.com 1997–1999: the dot-com run and what came after
1997–1999 · +5,349% (54.5× on closes)
For scale: buying every US stock breakout from 2018 to 2026 with no selection returned a median −22.6% a year later, measured on the 14,674 with a full twelve months of data. How it was measured
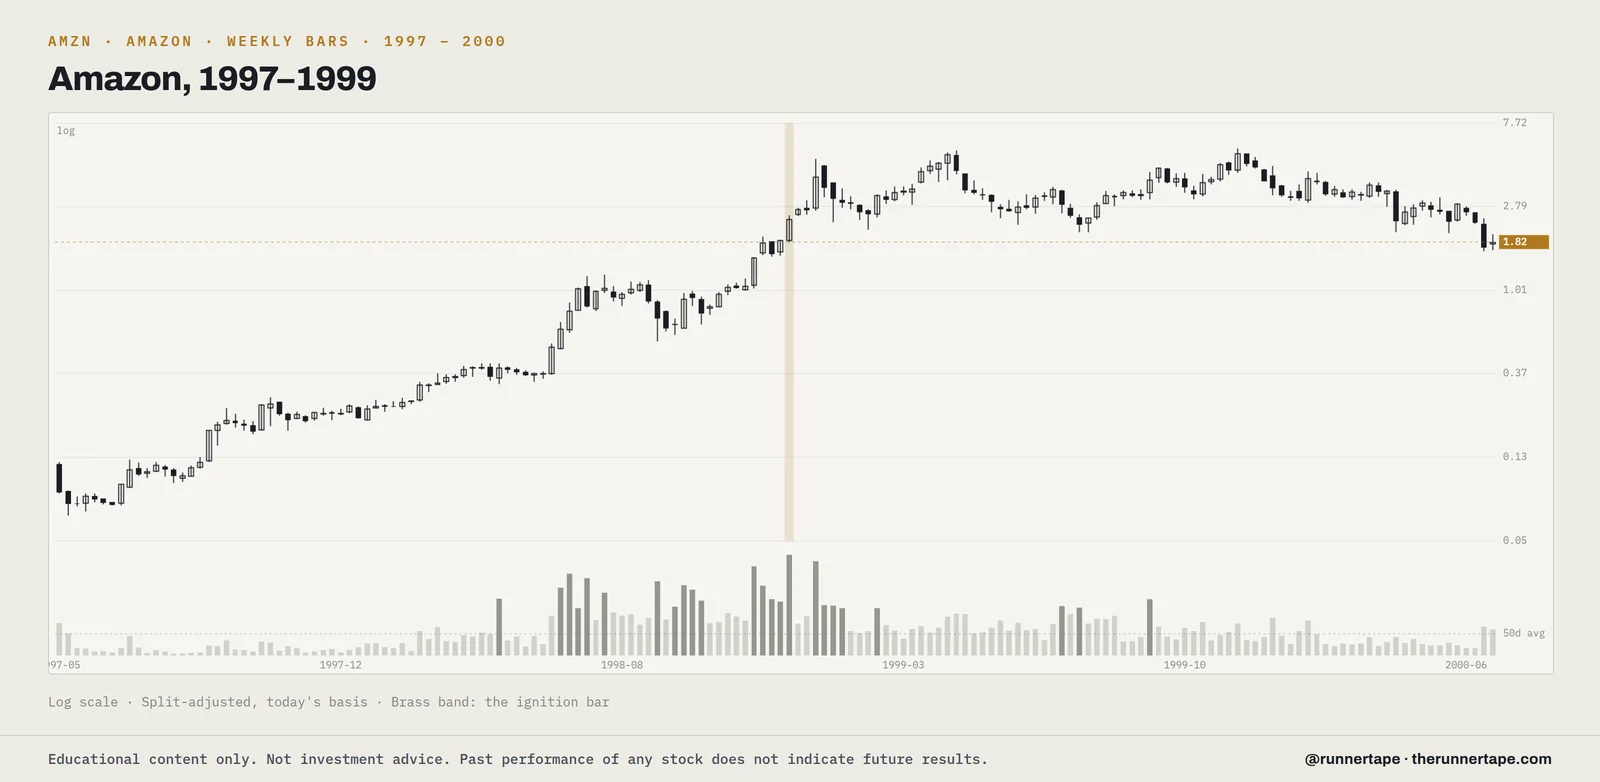
Amazon.com's run from 1997 to 1999 measures +5,349% (54.5× on closes). On 16 December 1998, Henry Blodget, an analyst at CIBC Oppenheimer, raised his target for the shares from $150 to $400, and the stock closed 19.3% higher that day. Doubts about the company were public too. On 31 May 1999, Barron's ran a cover story headlined "Amazon.bomb", arguing that the shares could be worth less than $10.
The run's high came at the end of 1999, and Time's issue of 27 December that year named Jeff Bezos its Person of the Year. In the dot-com decline that followed, the share price fell while the business kept expanding. In January 2002 Amazon reported fourth-quarter 2001 net sales of $1.12 billion, its first billion-dollar quarter, and net income of $5 million. It was the first quarter in its history to show net income.
This run is one of the free replays in the library: every bar, with the catalysts pinned to the day they landed. The library is opened by email.
Free: six classic runs
Sources: Benzinga, Dec 2021 · The Big Picture, Barron's cover of 31 May 1999 · TIME cover, 27 Dec 1999 · Amazon Q4 2001 results. Price figures are split-adjusted, not dividend-adjusted.
The Runner Tape and its staff hold no financial or other interest, direct or indirect, in AMZN — no shares, no options or other derivatives, no compensation or arrangement of any kind connected with it — and have received no consideration from any person in connection with it being covered here.