AAPL · Apple
Apple 2003–2012: from the iTunes Music Store to $700 a share
2003–2012 · ~111×
For scale: buying every US stock breakout from 2018 to 2026 with no selection returned a median −22.6% a year later, measured on the 14,674 with a full twelve months of data. How it was measured
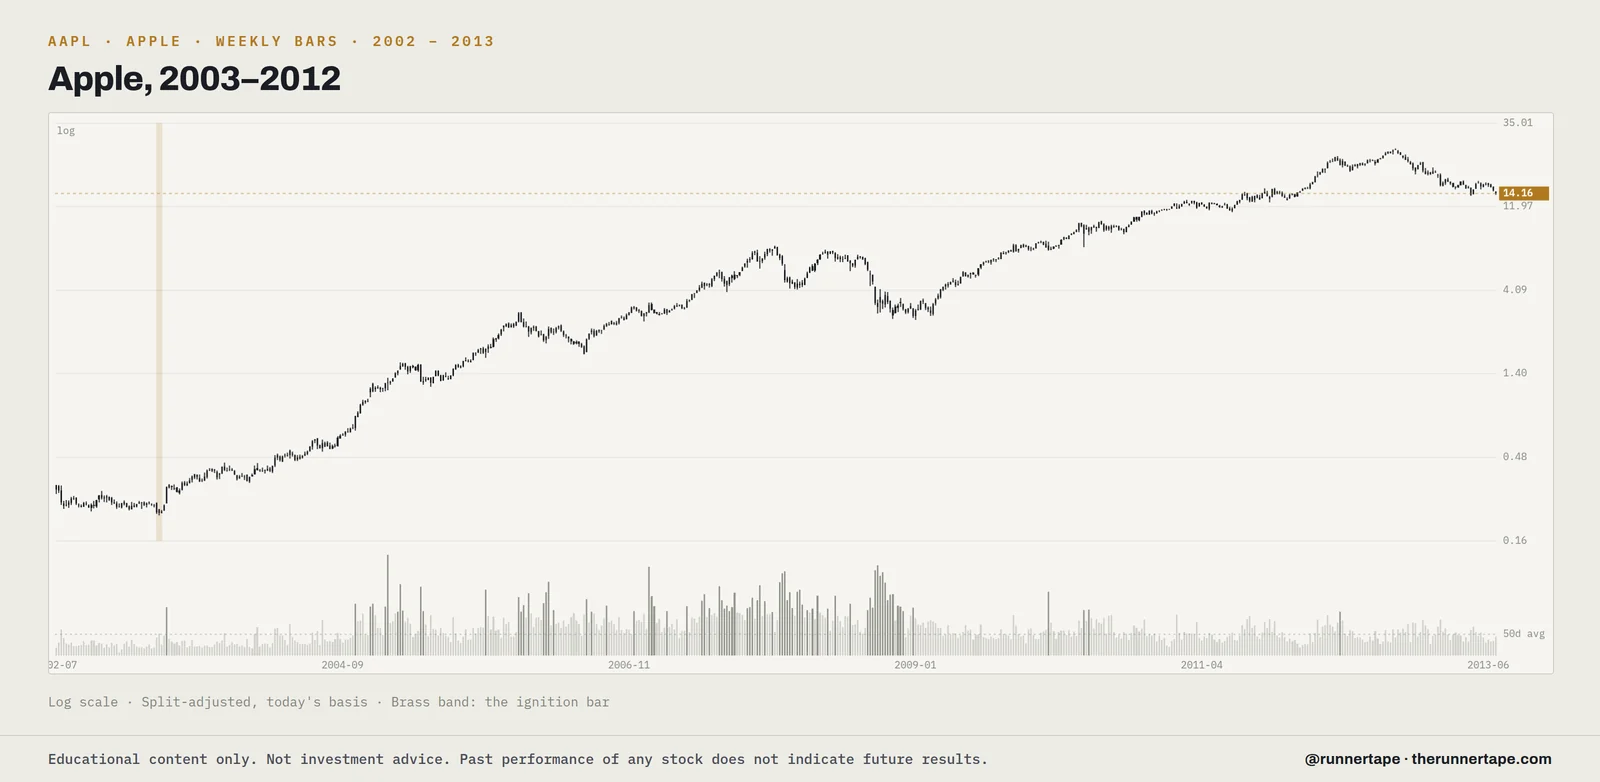
Apple's run from 2003 to 2012 measures ~111×. At the end of its 2002 fiscal year Apple held $4.3 billion in cash and short-term investments. On 29 March 2003, according to its annual filing, the shares held by non-affiliates had a market value of about $4.5 billion. Fiscal 2003 sales were $6.2 billion, and net income $69 million. In May 2003 Apple said its new iTunes Music Store had sold more than one million songs in its first week.
Growth arrived in product cycles, from the iPod to the iPhone and the iPad. For fiscal 2012 Apple reported more than $41 billion in net income, and it sold 26.9 million iPhones in that year's fourth quarter. On 17 September 2012 the shares reached $700 after iPhone 5 preorders reached two million in 24 hours, and the run's high came later that month. Over the following months the stock fell back as gross margins narrowed and growth slowed.
This run is one of the free replays in the library: every bar, with the catalysts pinned to the day they landed. The library is opened by email.
Free: six classic runs
Sources: Apple FY2003 10-K (SEC) · Apple, 5 May 2003 · Apple FY2012 Q4 results, 25 Oct 2012 · Cult of Mac, Sep 2012. Price figures are split-adjusted, not dividend-adjusted.
The Runner Tape and its staff hold no financial or other interest, direct or indirect, in AAPL — no shares, no options or other derivatives, no compensation or arrangement of any kind connected with it — and have received no consideration from any person in connection with it being covered here.